May 20, 2026 · case study · CS-001
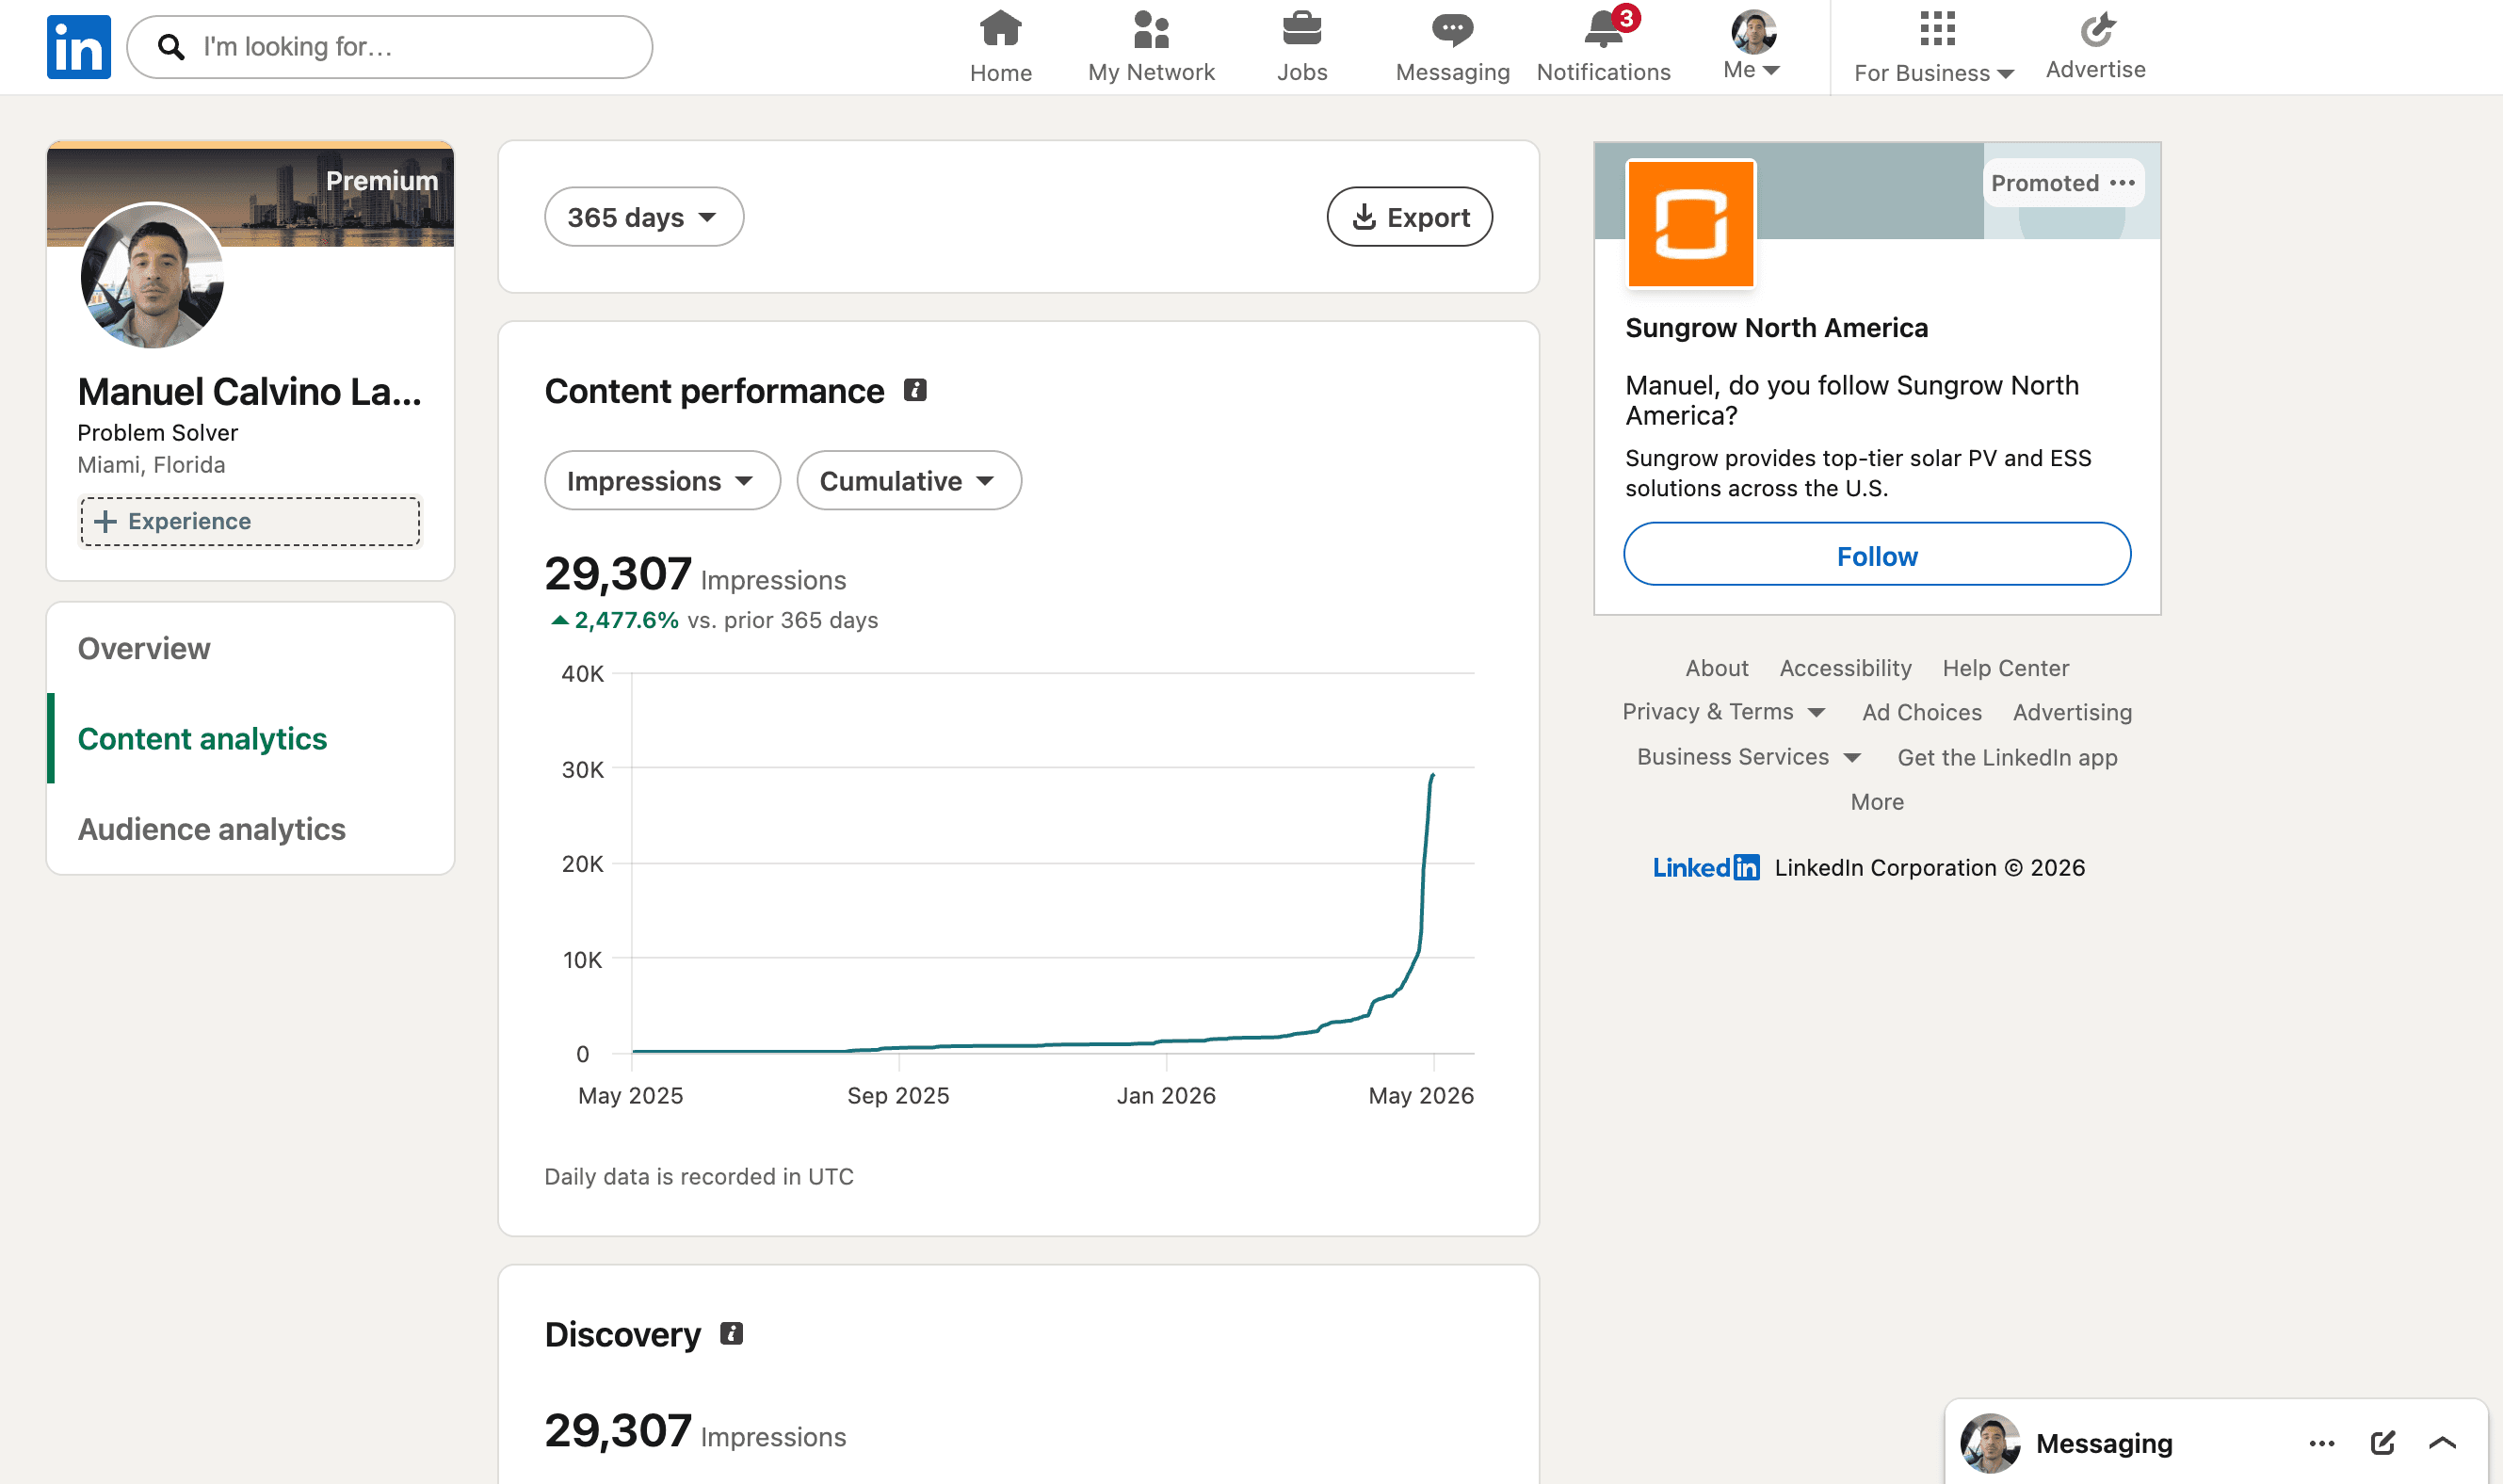
+2,477% in 30 days.
How one Chrome extension changed what we measure on LinkedIn — and why the post stopped being the lever.
For 12 months we posted to a flat line. Then we shipped a small browser extension that turned every comment GIF into a tracked link. We pointed it at our own profile to see what would happen. This is what happened.
The thesis: the growth lever isn't your post
For about a year, we did what every “build in public” guide said: post consistently, reply to everything, write hooks that work. Impressions stayed flat. The number we cared about — strangers seeing the work — did not move.
We started watching what high-reach accounts on LinkedIn actually do, frame by frame. The pattern was not better posts. It was tighter orbit — the comments, the GIFs, the saved links, the inbound DMs. The platform was rewarding the activity layer that wraps a post, not the post itself.
LinkedIn rewards the comment thread over the post. Every commenter is a distribution vector you do not own.
The interesting move, then, is to own a surface that activates when someone reacts to you — not when you publish. We picked the smallest such surface that hadn't been claimed: comment GIFs.
The build: a Chrome extension for comment GIFs
We built giffpop: a browser extension that intercepts the GIF picker inside LinkedIn comments. When someone uses it to drop a reaction GIF on a post, the GIF still plays — but it points back to a landing page we chose.
- Install on Chrome. The extension sits inside the LinkedIn comment composer.
- Drop a GIF on any comment, as usual. It looks and feels like LinkedIn's native picker.
- Every viewer who clicks the GIF lands on a page you control — your project, your demo, your sign-up form.
Then we did the only experiment that actually validates a product: we used it on ourselves first, for one month, on the same posting cadence we had been on for a year. No paid promotion, no new content strategy.
The data: one month, four lines moving together
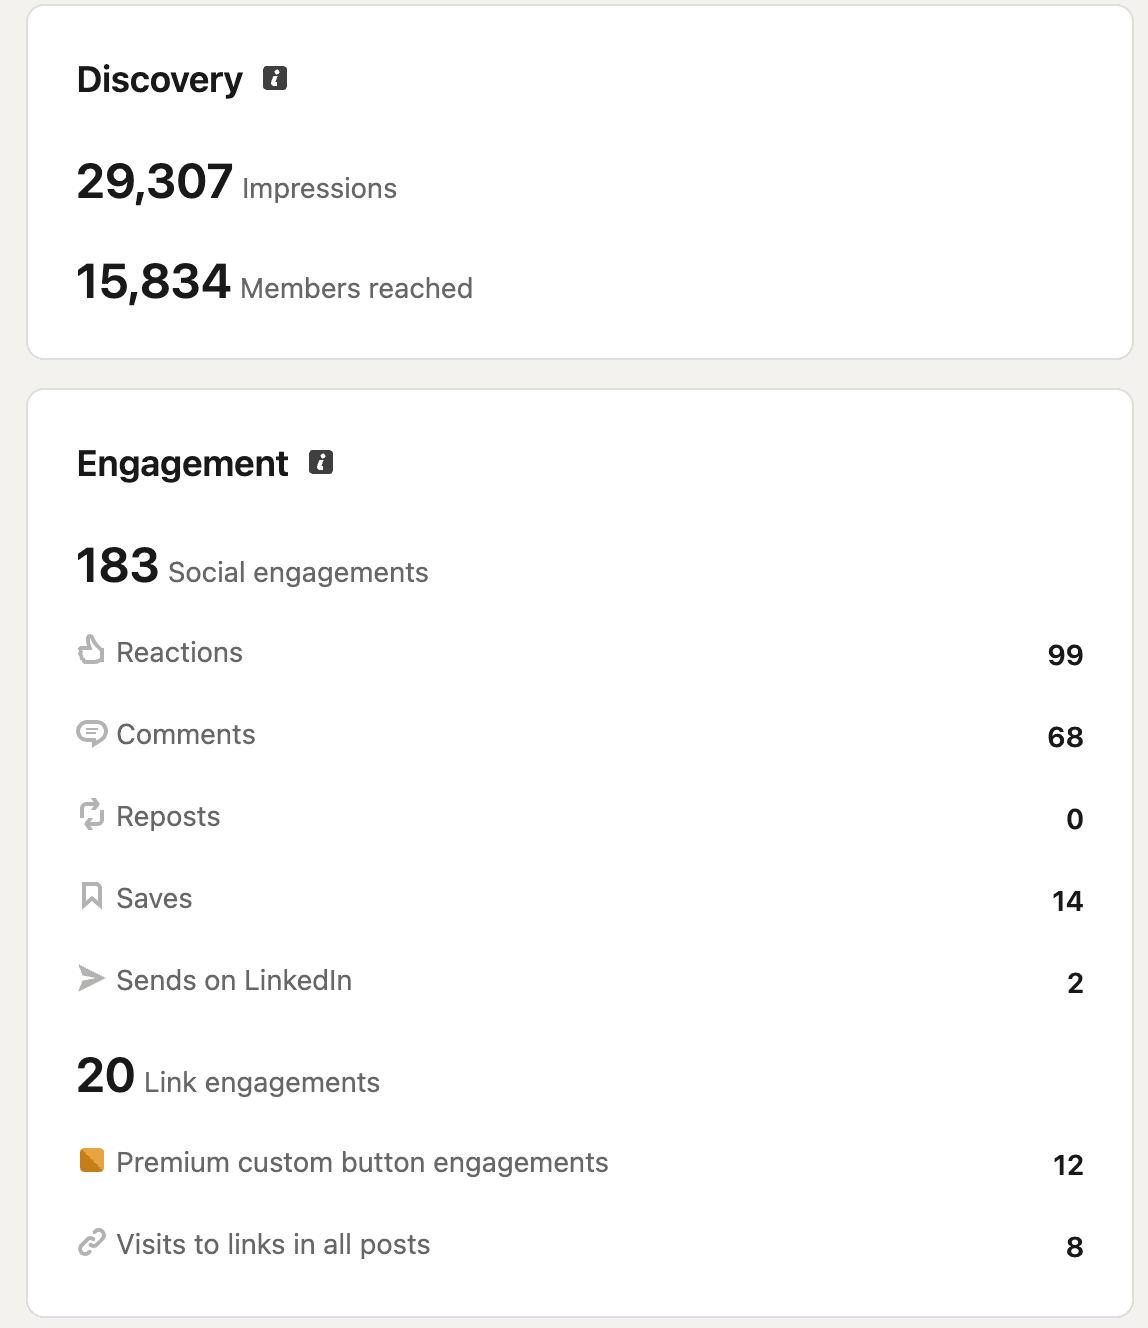
Two things matter more than the headline number.
First: the 15,834 members reached figure is a unique-human count — these are not impressions from one noisy follower refreshing. They are 15,834 distinct LinkedIn members.
Second: 14 saves and 20 link engagements is what builders care about. Saves are a soft buy-signal; link clicks start the attribution trail. The dashboard hides them under “Engagement” — they are the only line that converts.
Caveat — the analytics window is trailing 365 days, so most of the lift compresses into the final month and the YoY base is correctly flattering. The point of the chart is not the absolute number; it is the inflection.
Which posts compounded
A useful failure mode of distribution tools is that they amplify your worst content. Our experience was the opposite — the posts with a sharp builder thesis pulled the line, and the soft / memoir posts stayed soft.
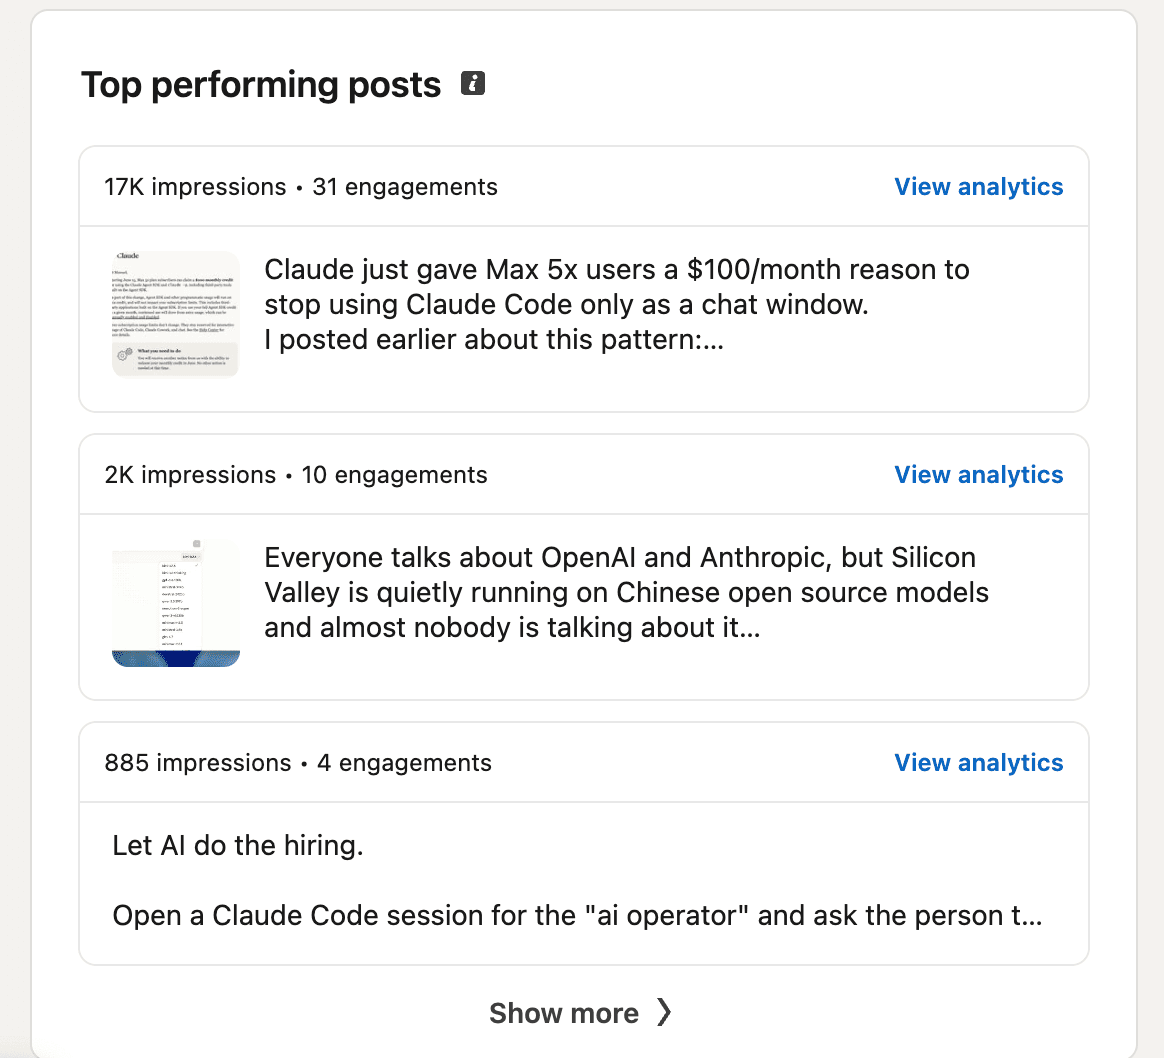
| Reach | Thread | Why it traveled |
|---|---|---|
| 17K | Claude Code economics | Specific dollar number, named audience, contrarian framing on a vendor announcement. |
| 2K | Chinese-OSS stack | Names Cursor / Kimi, Shopify / Qwen. Memetic, repeatable thesis. Survived translation to X. |
| 885 | AI hiring agent | Specific workflow, useful even without engagement. |
A post hits when the thesis is sharp. A profile compounds when each hit installs a trackable surface in the comments it earns.
Three patterns you can run this week
- Pick the orbit, not the object. Audit your last 10 posts. For each one, count the comments that generated a new reader. That's your real distribution layer — invest there before you invest in another posting calendar.
- Own a surface that activates on reaction. A tracked GIF, a custom Premium button, a reply-template DM. Anything that fires when someone moves toward you, not when you publish.
- Run the engine on yourself first. Whatever lever you build for clients, point it at your own profile for a measurable window. The proof you can sell is the line you already moved.
The bar for a builder's case study is not “did it grow.” It's: did the line move on a surface I controlled, with a lever I could ship to someone else.
Receipts
Everything on this page is verifiable. The screenshots above are the unedited LinkedIn analytics surface. Below are the live receipts — the feed where the experiment runs, the extension that ran it, and the PDF if you want to send the whole story to a colleague.